
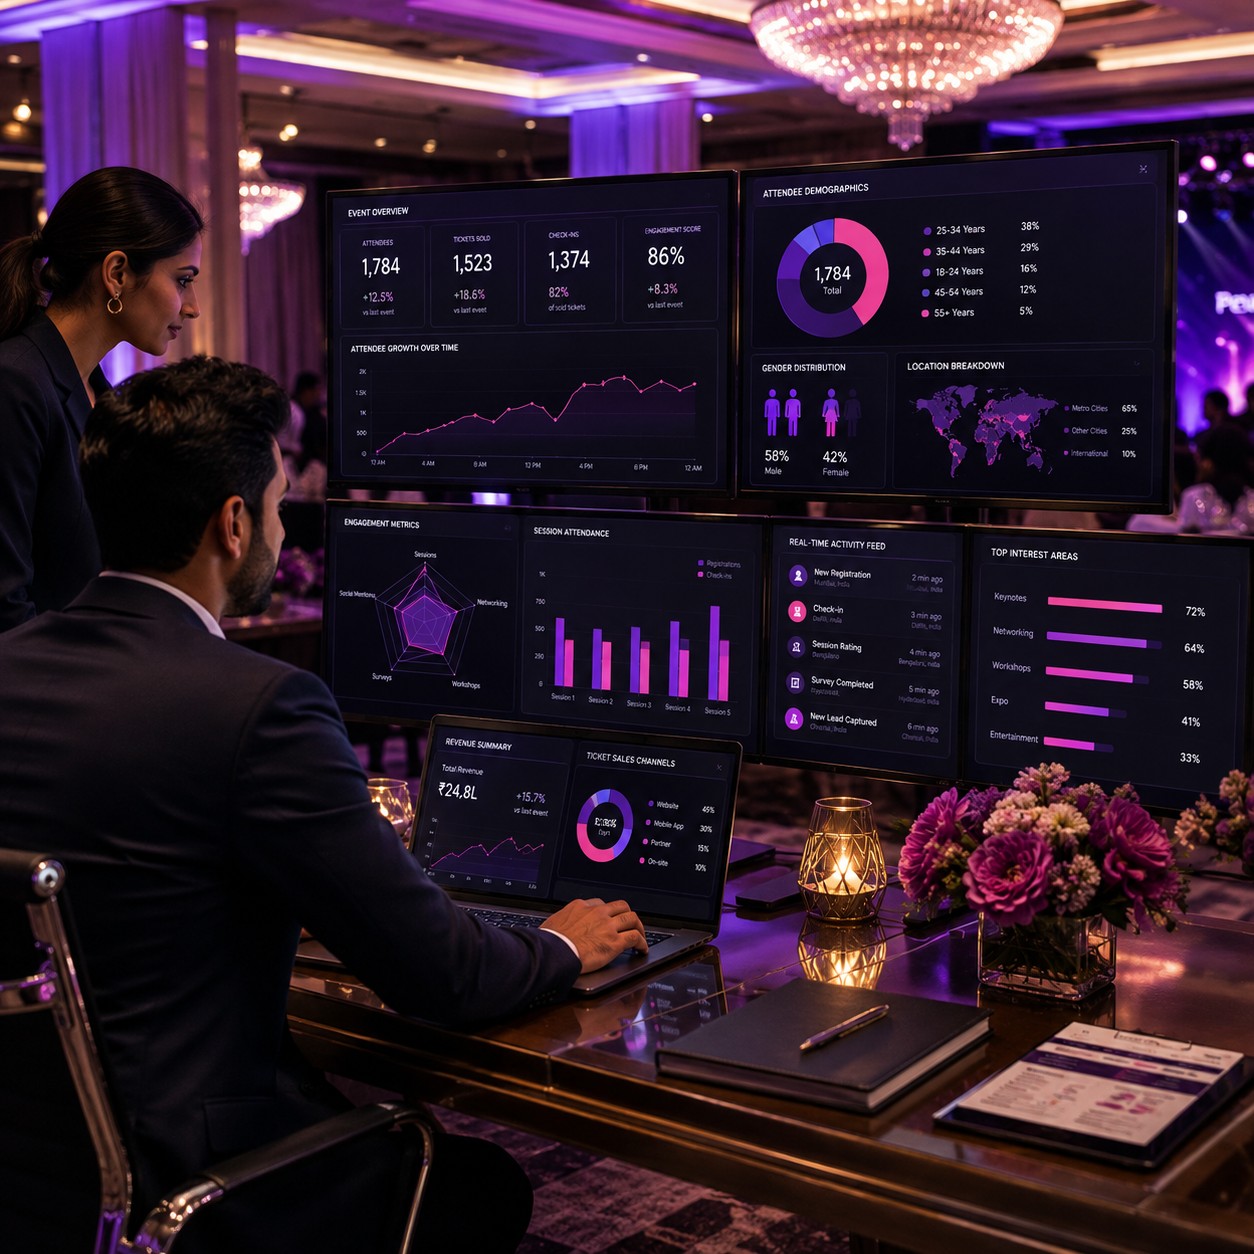
Celebration Analytics Data Dashboards
Celebration analytics dashboards organise attendance metrics, engagement reports and performance insights to help evaluate corporate gatherings and event outcomes.
Explore Digital & Tech-Enabled Event Experiences





Explore Other Experiences

















Explore by Occasion






Celebration Analytics Data Dashboards and Event Performance Insights for Corporate Gatherings
◆Corporate gatherings generate information across registration, attendance, participation, session activity and post-event feedback. Celebration analytics data dashboards bring selected event information together in a structured digital view.
Depending on the analytics platform, organisers can review attendance metrics, engagement indicators, survey results and other event performance information. The available data depends on the registration, polling, ticketing and event-management systems connected to the dashboard.
The Art of Celebration Analytics
Event analytics transforms collected event information into reports and visual summaries. Instead of reviewing individual records separately, organisers can use dashboards to identify patterns in attendance, participation and engagement.
The usefulness of an analytics dashboard depends on the quality, completeness and consistency of the underlying event data.
Attendance Metrics
Attendance metrics can show how many registered attendees checked in, participated or attended particular parts of a corporate gathering where the relevant information is captured.
Organisers can use these figures to compare expected attendance with actual participation.
Attendance Tracking
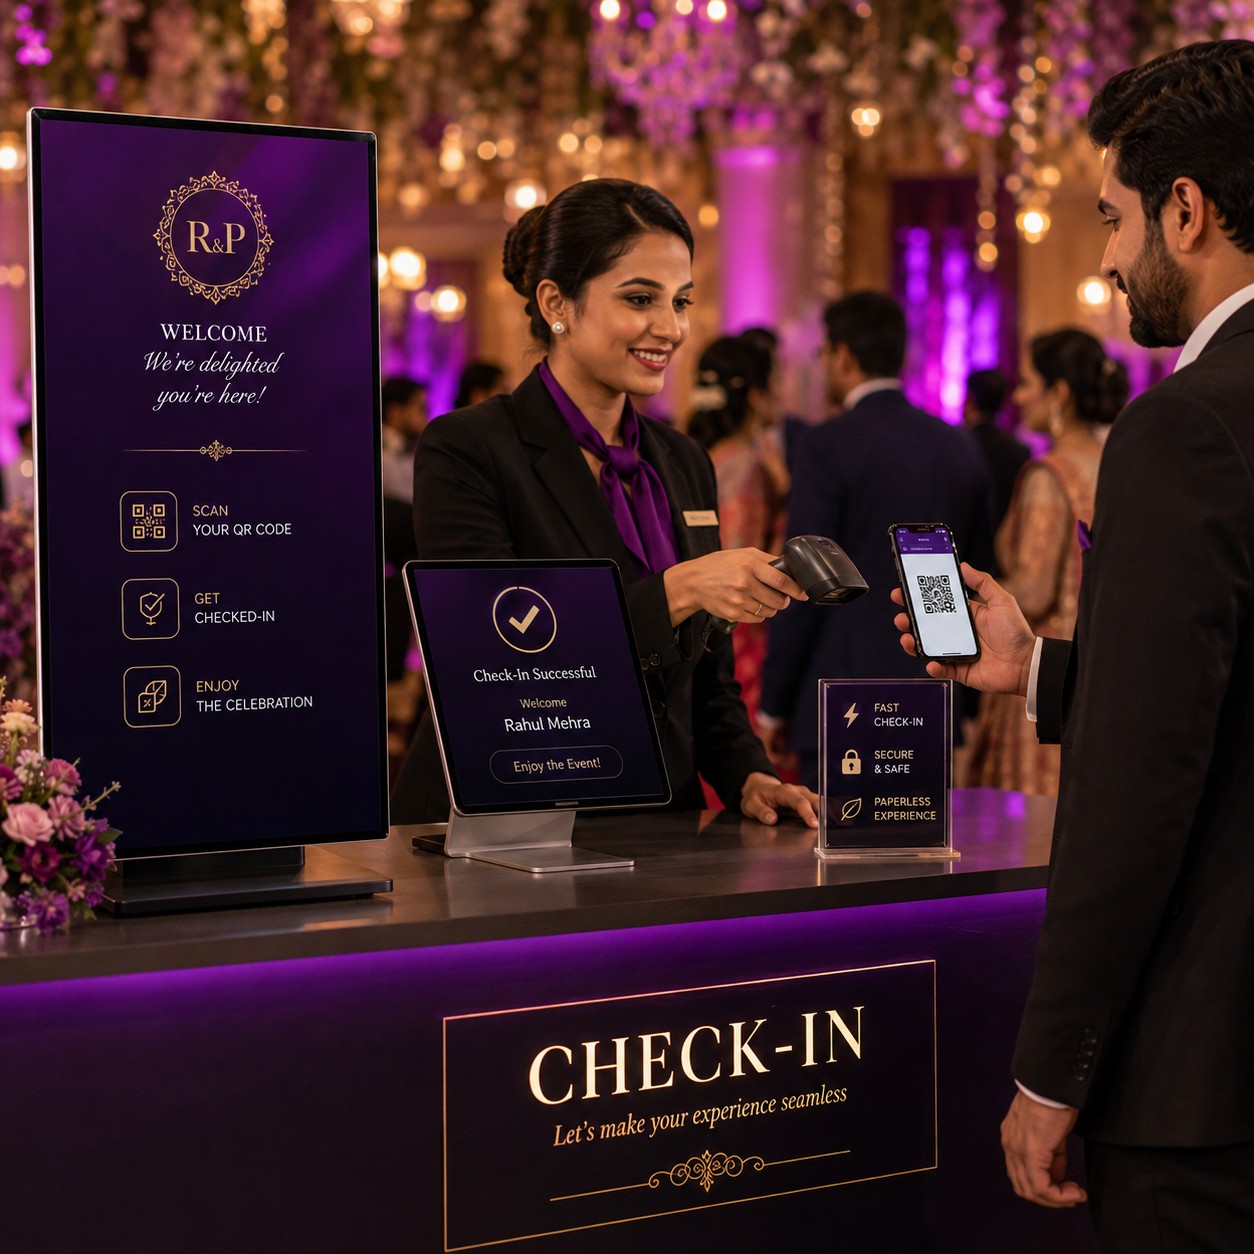
Digital registration and check-in systems can provide the underlying attendance information for an analytics dashboard. Check-in records can be aggregated to show overall attendance and arrival patterns.
The exact metrics available depend on the connected registration system.
Registration Analytics
Registration data can provide information about the number and categories of people who signed up for a corporate event. Dashboards can present registration totals and other supported registration indicators.
Registration figures should be distinguished from actual attendance where not every registered participant attends.
Guest Arrival Metrics
Check-in timestamps can help organisers understand when attendees arrived at the venue. This can reveal periods of high arrival activity and help evaluate registration operations.
Such analysis requires a check-in system that records arrival times.
Engagement Reports
Engagement reports can summarise participation in activities such as live polls, surveys, session interactions or other digital event features.
The available engagement indicators depend on the event technologies used.
Audience Polling Analytics
Live polling systems can generate response data from conference sessions and corporate gatherings. Analytics dashboards can present response counts, participation rates or aggregated poll results where supported.
Poll results should be interpreted in the context of the number of attendees who actually responded.
Interactive Survey Results
Survey responses can provide information about attendee opinions and feedback. Dashboards can organise survey results into summaries that are easier for organisers to review.
Question design and response rates can affect the usefulness of the resulting insights.
Session Engagement
For conferences and corporate gatherings with multiple sessions, analytics can help organisers review participation across individual programme segments where session-level data is available.
This can highlight sessions with higher or lower recorded participation.
Event Performance Insights
Performance insights combine selected event metrics to help organisers evaluate how a corporate gathering performed against its objectives.
The appropriate indicators depend on the type of event and the goals established before the gathering.
Corporate Event Dashboards
A corporate event dashboard can provide a central view of selected event information. It may combine attendance, registration, engagement and feedback data from connected systems.
Dashboard layouts and integrations vary between analytics platforms.
Real-Time Event Data
Some systems can update dashboards as new registration, check-in or engagement information becomes available. Real-time reporting can help event teams monitor an ongoing gathering.
The frequency of updates depends on the connected systems and platform architecture.
Post-Event Analytics
After the corporate gathering, organisers can review accumulated attendance, engagement and feedback information. Post-event analysis can support reporting and planning for future gatherings.
Reports should distinguish between directly recorded metrics and estimates or derived indicators.
Attendance Comparison
Organisers can compare registration numbers with actual check-ins to understand the difference between expected and recorded attendance.
For recurring events, attendance figures can also be compared across different editions when the underlying data is consistently collected.
Engagement Rate
An engagement rate can be calculated according to the specific interaction being measured, such as the proportion of attendees responding to a poll.
The definition should be stated clearly because different event platforms may use different engagement calculations.
Response Rate
Survey response rates indicate the proportion of invited or eligible participants who submitted responses, depending on the chosen calculation method.
Response rates should be interpreted alongside the total eligible audience and survey methodology.
Event Feedback Analytics
Feedback analytics can organise attendee comments, ratings and survey responses. These insights can help organisers identify aspects of the event that participants considered useful or requiring improvement.
Qualitative comments may require separate review rather than relying solely on numerical summaries.
Speaker and Session Feedback
Corporate gatherings can collect feedback about individual speakers or sessions where surveys include these questions. Dashboard reports can present aggregated ratings and response counts.
Speaker comparisons should account for differences in session size and audience composition.
Networking Engagement
Some event platforms capture information about networking interactions, meeting participation or other digital networking activities. Where available, these metrics can be included in event reports.
Not all networking activity can be captured digitally, so dashboard figures may represent only recorded interactions.
Digital Event Engagement
Virtual and hybrid corporate gatherings can generate additional digital participation data. This may include online attendance, session participation, polling and other supported interactions.
The dashboard should clearly distinguish virtual participation from physical attendance where both are involved.
Hybrid Event Analytics
Hybrid gatherings may combine onsite and online participation. An analytics dashboard can bring together available data from both environments where the relevant systems can be integrated.
Metrics should use consistent definitions when comparing onsite and remote audiences.
Event Registration Sources
If registration information records how attendees arrived at the registration page or invitation, dashboards may be able to compare registration sources.
This information can help organisers understand which registration channels generated attendees when such tracking is implemented.
Event Capacity Analysis
Attendance data can be compared with venue capacity or planned capacity to understand utilisation.
Capacity figures should be based on the appropriate venue configuration and applicable safety or operational limits.
Peak Attendance
For events with session-level or time-based check-in data, analytics can identify periods with higher recorded attendance.
Peak figures can help organisers evaluate space, staffing and programme scheduling.
Event Operations Reporting
Analytics can support operational reporting by bringing together information about registration, check-in and programme participation.
Event teams can use these reports to review processes after the gathering.
Data Visualisation
Dashboards can present event information through charts, tables, indicators and other visual formats. Effective visualisation can make large datasets easier to review.
The display should prioritise metrics relevant to the event's objectives rather than presenting every available data point.
Custom Event Reports
Some analytics platforms allow organisers to select which metrics appear in a report or dashboard. Custom reports can be structured for management, event teams or other authorised stakeholders.
Reporting requirements should be defined before configuring the dashboard.
Management Performance Reports
Corporate management may require concise summaries of attendance, participation and feedback. A dashboard can provide selected key indicators without requiring stakeholders to review detailed event records.
The reported figures should include appropriate definitions and time periods.
Event Benchmarking
For recurring corporate gatherings, organisers may compare metrics across previous events. Consistent data collection makes these comparisons more meaningful.
Changes in registration methods, audience composition or measurement definitions should be considered when interpreting historical comparisons.
Data Integration
Event analytics dashboards may connect with registration platforms, QR check-in systems, live polling tools, survey platforms or other event technologies.
The scope of integration depends on the systems involved and their available data connections.
Data Accuracy
Dashboard results are only as reliable as the information supplied by the connected systems. Duplicate registrations, incomplete check-ins or missing survey responses can affect reported figures.
Data validation should be included in the event reporting process.
Data Privacy
Event analytics can involve personal information, attendance records and participant responses. Organisers should determine what information is necessary for reporting and restrict access to authorised users.
Data handling should follow applicable privacy requirements and the policies established for the corporate gathering.
Secure Analytics Access
Dashboard access should be controlled so that event information is available only to authorised personnel. User permissions can help separate administrative, operational and reporting responsibilities where supported.
Access settings should be reviewed before and after the event.
Planning Your Celebration Analytics Dashboard
Begin by identifying the questions the dashboard needs to answer. Determine whether the focus is attendance, registration, engagement, feedback, session participation or overall event performance.
Next, identify the systems that generate the required data and establish consistent definitions for each metric. Configure the dashboard, test the data flow and verify sample reports before the corporate gathering.
Booking Celebration Analytics Services
When arranging celebration analytics services, consider attendance metrics, registration data, check-in records, engagement reports, polling results, survey feedback, session participation, real-time updates, dashboard customisation, data integration, privacy and reporting requirements.
A professional event analytics provider can organise available corporate gathering data into dashboards and performance reports. Organisers should confirm supported integrations, metric definitions, reporting frequency, access controls and data-handling procedures before deployment.
Frequently Asked Questions
1. What are celebration analytics data dashboards?
They are digital dashboards that organise event information such as attendance, registration, engagement and feedback into visual reports and performance summaries.
2. What are attendance metrics?
Attendance metrics are measurements based on recorded registration, check-in or participation information, such as registered attendees and confirmed check-ins.
3. Can dashboards show real-time attendance?
Some platforms can update attendance information as check-ins are recorded. The availability and update frequency depend on the connected event systems.
4. Can live polling data be included?
Yes, where the analytics platform integrates with the polling system. Poll response counts and aggregated results can then form part of the event reporting.
5. Can survey feedback be analysed?
Yes. Survey ratings and responses can be summarised in dashboards when the survey platform provides compatible data.
6. Can analytics compare different corporate events?
Yes, recurring events can be compared when comparable metrics have been consistently collected and defined.
7. Can hybrid events use analytics dashboards?
Yes. Onsite and virtual participation data can be combined where the relevant systems support integration.
8. How accurate are event analytics reports?
Accuracy depends on the underlying registration, check-in and engagement data. Missing records, duplicate entries or inconsistent measurement methods can affect results.
9. Can event dashboards be customised?
Some platforms allow organisers to select metrics, charts and reporting views according to their requirements.
10. What should I consider when booking celebration analytics services?
Consider attendance tracking, registration data, engagement metrics, survey reports, session analytics, real-time updates, integrations, dashboard customisation, privacy, access controls and reporting requirements.